

People return to their cars while avoiding mass transit in Washington – ClarkCountyToday.com

WSDOT updates transportation in the state due to the pandemic and lockdown
Each quarter, the Washington State Department of Transportation (WSDOT) publishes a Gray Notebook to inform citizens and legislators about the state of transportation in Washington. The March 2021 snapshot revealed some important perspective on the choices of drivers as the state began recovering from the pandemic lockdown.
People have resumed using their cars. WSDOT reports “8 percent fewer vehicles traveling on monitored state highways on Monday, May 3, 2021 than on Monday, May 6, 2019 due to Washington’s continued response to the COVID-19 pandemic.”
When it comes to mass transit and public transportation, it was a different story. They report a 79 percent decrease in ridership on Amtrak Cascades in 2020 compared to 2019. Washington State Ferries ridership was 35 percent below its pre-pandemic levels as of May 3, 2021, an increase of three percentage points from March 1, 2021.
Mass transit (buses and light rail) had declined 77 percent with the low point in April 2020. As of May 3, 2021 transit ridership was down 59 percent. People remain reluctant to get back on mass transit, as evidenced by C-TRAN’s recent announcement of service cuts to it’s cross river service to Portland and the decision to focus on microtransit.
An interesting tidbit for Clark County was that early on in the pandemic, freight dropped by 71 percent in April 2020. As of May 2021, it’s only down by 13 percent.
The Washington State Department of Transportation reports quarterly performance metrics on the transportation system. Safety and preservation metrics met goals. People returned to using their cars, while continuing to avoid most forms of mass transit. Graphic courtesy of WSDOT
Early in the pandemic, Washington state experienced large increases in the percentages of people walking and bicycling (active transportation) with both modes frequently much higher than 2019 levels. Active modes for early May 2021 had mixed results compared to 2019 levels, with pedestrian travel up 7 percent and bicycling down 40 percent as of May 3, 2021.
The state has a COVID-19 Transportation Dashboard to track the pandemic’s impact. It shows highway traffic down just 4 percent as of July 20. Here in Clark County, I-205 traffic at SR-14 is down 5 percent whereas I-5 traffic is up 4 percent compared to two years ago.
Tolling facilities are showing a 22 percent decline in vehicles. That’s different from toll revenues, which have been down significantly more. In fact, the state Transportation Commission just voted to consider increasing tolls next year on many Washington tolling facilities due to the loss of revenue.
The dashboard shows transit ridership down statewide by 45 percent. C-TRAN appears to be experiencing the smallest declines of all the reporting transit agencies around the state.
Air travel is up compared to 2020 levels. In March 2021 (the most recent month for which data is available), domestic air travel at SeaTac airport was 22.1 percentage points higher than in December 2020, and international air travel was up 2.2 percent over the same period. Despite these changes, domestic air travel was 43.1 percent lower in March 2021 than in March 2019, and international air travel was 81.9 percent lower for the same period.
FHWA data
The Federal Highway Administration (FHWA) requires states to report on numerous safety factors related to highways, bridges, and other transportation facilities. The FHWA previously determined WSDOT did not make significant progress toward achieving its 2019 targets for highway safety. States that did not make significant progress have a special reporting requirement and have financial penalties imposed.
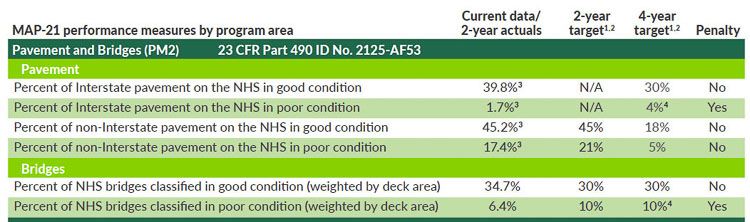 The state failed to meet goals for repairing interstate highways and bridges and is facing penalties and extra required reports according to the Grey Book report. Graphic courtesy of WSDOT
Washington failed to meet goals and has financial penalties in several areas. These include the percent of Interstate pavement on the national highway system (NHS) in poor condition and the percent of bridges on the NHS in poor condition.
One measure showing the impact of the pandemic and the governor’s lockdown of the state was accident and incident response. WSDOT responded to 10,968 incidents during the first quarter of 2021, 16.7 percent fewer than during the same quarter in 2020. On average, WSDOT teams are responding to an accident or incident every 12 minutes.
State Ferries
The Washington State Ferries have been operating on a modified winter schedule
since March 2020 due to the COVID-19 pandemic. They operated 7 percent fewer ferries than pre-pandemic levels.
In the third quarter of Fiscal Year 2021, WSF canceled 702 trips and replaced 42 of them, resulting in 660 net missed trips. This was 371 more than the 289 net missed trips during the same quarter in FY2020. The second highest cancellation category was vessel breakdowns (148).
WSF ridership was approximately 3.1 million during the third quarter of FY2021. This was about 943,000 (23.1 percent) fewer passengers than in the corresponding quarter of FY2020. Farebox revenue was $2.4 million (7.3 percent) less than in the same quarter in FY2020, and about $2.1 million (6.4 percent) less than projected revenue ($32.9 million).
In spite of declining WSF ridership and operating fewer trips, employee injuries jumped significantly. The rate of Occupational Safety and Health Administration recordable crew injuries per 10,000 revenue service hours increased from 6.3 in the third quarter of FY2020 to 10.1 in the third quarter of FY2021.
Amtrak
A total of 172,000 people rode Amtrak Cascades trains in 2020 — a 79 percent decrease from 824,000 in 2019. Ticket revenue decreased 80 percent from $33.2 million in 2019 to $6.5 million in 2020. On-time performance improved from 58 percent in 2019 to 62 percent in 2020, but remained below the target of 88 percent.
Pre-pandemic Amtrak Cascades train service consisted of four daily round trips between Seattle and Portland; two daily round trips between Seattle and Vancouver, BC; and two daily round trips between Portland and Eugene. In March 2020, as a result of the spread of COVID-19, Amtrak Cascades reduced service to one daily round trip between Seattle and Eugene. All other train service was suspended, including all service north of Seattle (due to the Canadian border closure).
 Ridership on the Amtrak Cascades line between Vancouver, BC and Eugene declined precipitously due to pandemic-related service cuts. Graphic from WSDOT
The two busiest stations on the Amtrak Cascades corridor — King Street Station in Seattle and Union Station in Portland — saw approximately 81 percent and 79 percent fewer ons and offs in 2020 than in 2019, respectively. Passengers levels to Vancouver, WA had a 73 percent decline, from 78,000 to 21,000 in the report.
Amtrak experienced an 80 percent decrease in ticket revenue in 2020, which dropped from $33.2 million in 2019 to $6.5 million in 2020. The Seattle-to-Portland travel segment accounted for $2 million (31.3 percent) of ticket revenue, the largest share of any city pair. Ticket revenue on that segment alone was down 81 percent from $10.5 million in 2019.
Total revenue (tickets, food and beverage, and other fees) covered 21.7 percent of the Cascades’ $31 million total operating costs in 2020. This was a decrease of 38.1 percentage points from 59.8 percent in 2019.
Even with the significantly reduced service levels, Amtrak Cascades trains between Portland and Vancouver, BC experienced 34,964 minutes (over 582 hours) of delay. The trains were on time 62 percent of the time in 2020, up from 58 percent in 2019. In 2018, BNSF dispatchers in
Fort Worth determine the movement of both freight and passenger trains along the Amtrak
Cascades corridor, the company is tasked with minimizing delays due to train interference.
Freight movement
Weigh station bypasses (also known as green lights; see box at left) created roughly $24.7 million in economic benefits in 2020 by saving an estimated 204,000 hours of travel time and an estimated 1.3 million gallons of diesel fuel (see chart below). On average, each bypass saved freight carriers five minutes and $10.08 in operating and fuel costs by allowing truck drivers to
keep traveling at highway speeds instead of pulling off the highway to stop at weigh stations. The amount of diesel saved cut carbon dioxide emissions by approximately 30.2 million pounds in 2020.
Gas Taxes
The state legislature raised gas taxes three times in the past two decades. Increases were 5 cents in 2003 (Nickel package); 9.5 cents in 2005 (Transportation Partnership Account); and 11.9 cents in 2015 (Connecting Washington).
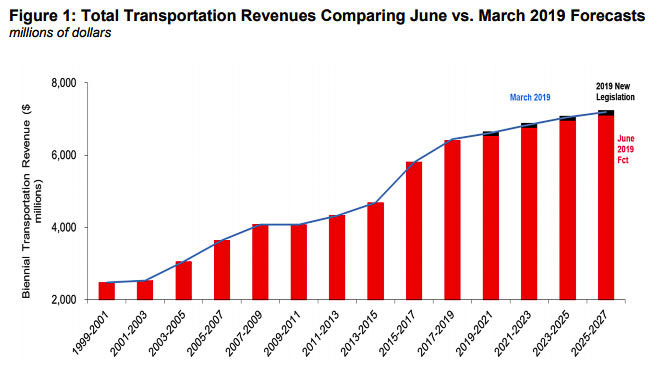 State transportation revenues have increased nearly every budget cycle, in part due to three gas tax increases in the past two decades. Graphic courtesy of Washington State Legislature
The Nickel and Transportation Partnership Account (TPA) funding continues to be lower than original projections. The 2007 Great Recession and the 2020 COVID-19 pandemic lockdown caused significant declines in both gasoline and diesel fuel usage and therefore gas tax revenues.
The legislature allocated $16.2 billion for 421 specific projects in the Nickel/TPA tax packages. To date WSDOT has completed 383 projects valued at $10.5 billion. There are 11 projects valued at $5 billion in the current transportation budget that are not complete. Additionally, there are 13 projects valued at $500 million that have been removed from Nickel/TPA lists and another five projects now funded by the 2015 (Connecting Washington) gas tax package.
Of interest to Clark County residents in the list of 13 deferred projects is the I-5/E Fork Lewis River Bridge Northbound project. The I-5/Southbound East Fork Lewis River to North Fork Lewis River — concrete pavement rehabilitation is shown as delayed.
Fuel tax revenues from the 2005 TPA package have been lower than the original March 2005 projection. The original projection for the TPA account was $4.9 billion over a 16-year period from 2005 through 2021. Current TPA projections through 2021 are estimated to be $3.9 billion, approximately $991 million (20.1 percent) less than the original 2005 projection.
The 2003 Nickel transportation package was originally a 10-year plan, with revenues forecasted to total $1.9 billion from 2003 through 2013. Fuel tax revenues collected during this period were 10.2 percent lower than the original March 2003 projection.
Looking Ahead
In the 2021 legislative session, two primary proposals moved through the House and Senate in Olympia. Neither were enacted, but they raised gas and other transportation taxes. Both proposals included funding for the Interstate Bridge Replacement Program.
Steve Hobbs heads the Senate Transportation committee. He is pushing for a special session of the legislature to pass his Forward Washington plan. He recently told the Lynwood Times “Out of the $17 billion, $5.2 billion has already been passed because of the cap and invest bill.”
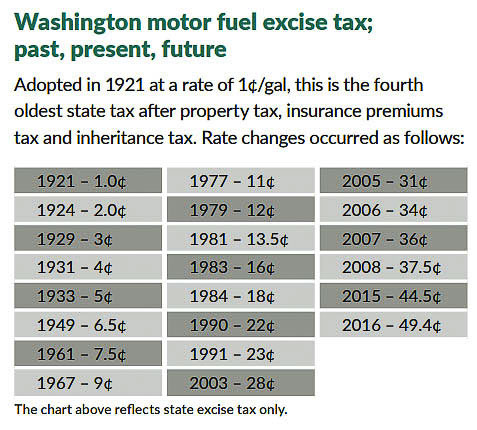 In the past two decades, the state legislature has raised gas taxes from 23 cents to 49.4 cents per gallon. Graphic courtesy of WSDOT
Hobbs continues to push for his infrastructure plan. He aims to have a special session in October or November.
Forward Washington counts on a 9.8 cent gas tax as well as a statewide transportation benefit assessment, a shift of the car sales and use tax on EVs/Hybrids (starting in 2026), and other vehicle and licensing fees according to Senate Democrats.
“My goal is really to have something that appeals to both sides of the aisle and across the state. I think it is important to have a broad range of support,” Hobbs said.
Mark Harmsworth of the Washington Policy Center believes the funding is not being spent wisely. Over the last 20 years he said the state has shifted from spending money on roads, which represents 96 percent of trips taken in Washington State.
“We used to spend 65 percent of our transportation dollars on fixing roads, now we’re spending 65 percent of our transportation funds on transit and transit only represents about 4 percent of trips taken in the state,” Harmsworth said.